Determination of Volatile Organic Compounds in Catalysts Using Anypu 7700 GC-MS
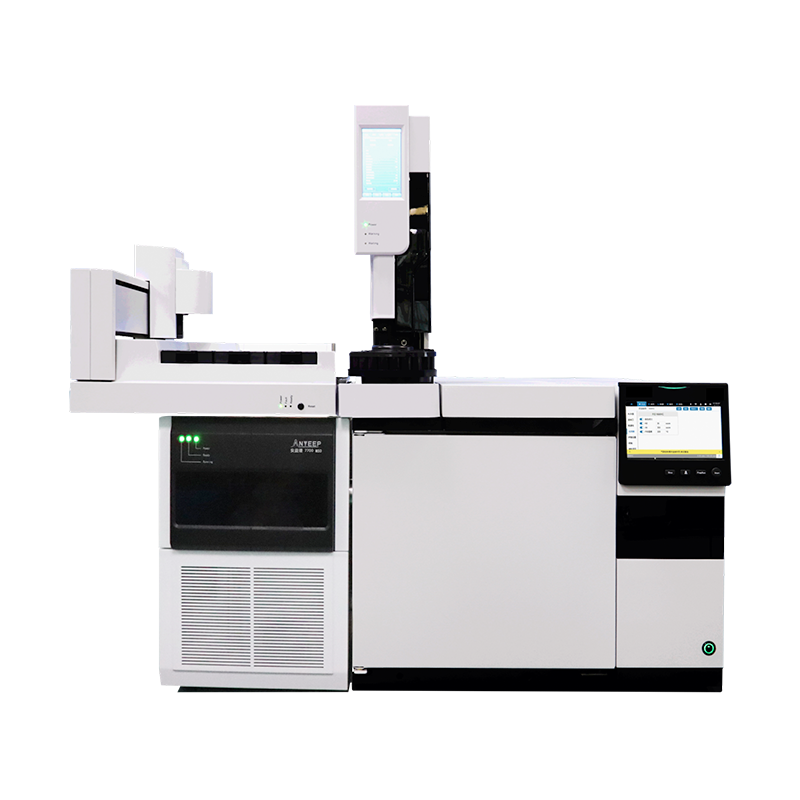
Use the AnYiPu 7700 GC-MS to separate and identify catalyst components using Scan mode. Acquire mass spectra for each compound, perform library searches, and conduct qualitative analysis of the catalyst components.
Experimental Conditions
Column: HP-5MS 30m × 0.25mm × 0.25µm; Temperature program: 40°C (1 min) → 10°C/min → 250°C
(8 min); Injection mode: Split; Split ratio: 5:1; Injection port temperature: 250°C; Column flow rate: 1.0mL/min
(Constant current); Injection volume: 1µL. Ion source temperature: 240℃; Transfer line temperature: 250℃; Solvent delay: 3 min; Scan
Mode: Full Scan; Scan Range: 40~350 amu; Ionization Energy: 70 eV; EM Voltage: 900 V.
Experimental Results
Weigh catalyst ash and red balls 0.4915g and 0.4959g, respectively. Add 5 mL of n-hexane solvent, perform ultrasonic extraction for 1 h, filter the supernatant through a membrane, and analyze by GC-MS. Under the specified instrument conditions, conduct full-scan qualitative analysis; the result with the highest similarity to the spectral library is selected as the final result.
Analysis results indicate that the red catalyst spheres have a complex composition consisting of over 60 compounds, primarily tributyl phosphate, 2-ethylanthraquinone, 2,3-DimethyL-1,4,4a,9a-tetrahydroanthracene-9,10-dione, and other simple benzene derivatives. The organic content in the gray catalyst material is low and limited to a few types, mainly simple benzene derivatives.
We compared the impact of different solvent extractions on detection using methanol and n-hexane. Results showed that compound identification and peak areas were consistent across both methods. However, methanol resulted in a highly turbid solution post-extraction, complicating membrane filtration; thus, n-hexane is the preferred extraction solvent. We also evaluated headspace GC-MS versus direct injection analysis. Both methods yielded consistent results for lower-boiling-point compounds (detected within 15 min). Due to minimal interference in the headspace method, peaks were cleaner with higher spectral library match rates. However, the temperature constraints of headspace equilibration prevented detection of higher-boiling-point compounds.